This is a tutorial on how to create 100% stack bar chart leveraging the power of Highcharts JS library in R. The code will go line by line in the following slides if you touch/click/scroll/press left or right arrow. For full screen go here - View full screen Do share...
[Read More]
XBox One in Numbers: Charting 78 Months of journey
A Metacritic Adventure
Few year back in 2017, I analyzed the state of different consoles this gen when Wii U was also in the mix(Check here Xbox One in Numbers). As we are nearing a new generation for Playstation and Xbox families, I think it is a good time to relook at their...
[Read More]
Mobile subscription by technologies
5G to accelerate within 2-3 years
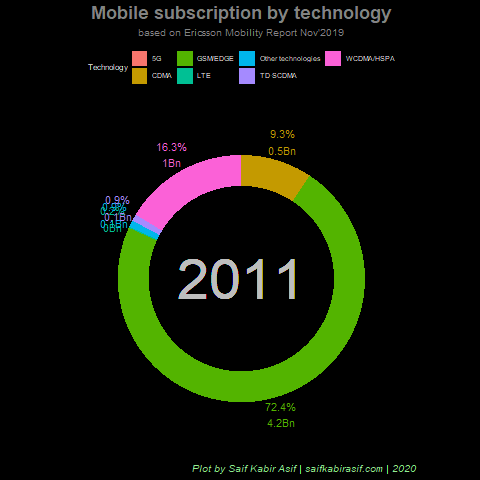
This is the first visualization of year 2020 where I intend to be more active in my blog. The visualization is about mobile subscription trend over the years. Although 4G/LTE is yet to peak, we expect to see huge adoption of 5G within 2-3 years as forecasted by Ericsson. The...
[Read More]
Visualizing Bangladesh Premier League Football 2019
Charting the rise of Bashundhara Kings
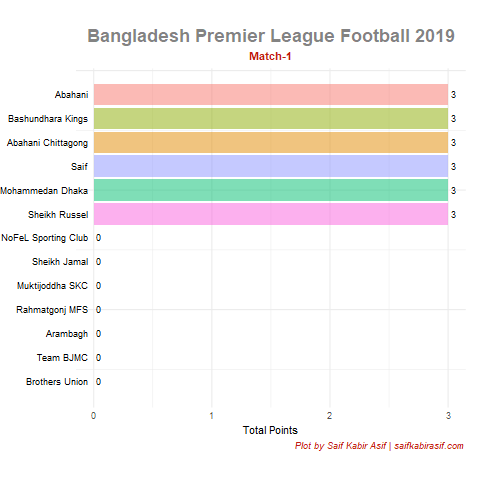
Though a bit late to the party, finally done with a racing bar chart with Bangladesh Premier League Football 2019 points table. Steps taken: Scraped match data from web Lots of cleansing and munging specially to interpolate a smooth transition between numbers Animation (easy part) Animation compression to save loading...
[Read More]
Wireless mobile technology launch over the years
Following the trail as the world enters 5G
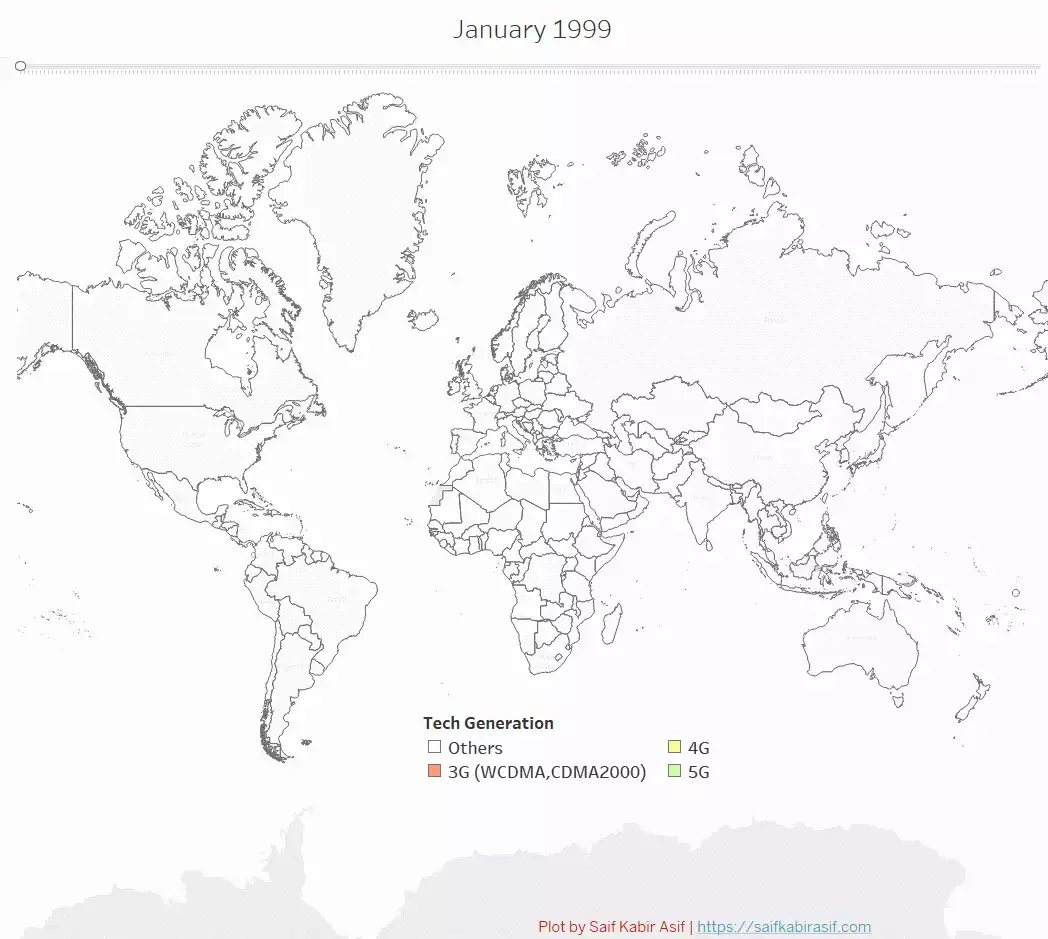
As the World slowly ventures into 5G era, I think this is a good time to trace the trail of wireless cellular technology adoption by countries over the years. Hence, this visualization charting the adoption of 3G,4G and 5G. Few Notes: As some of my peers was misinterpreting the visualization...
[Read More]


